
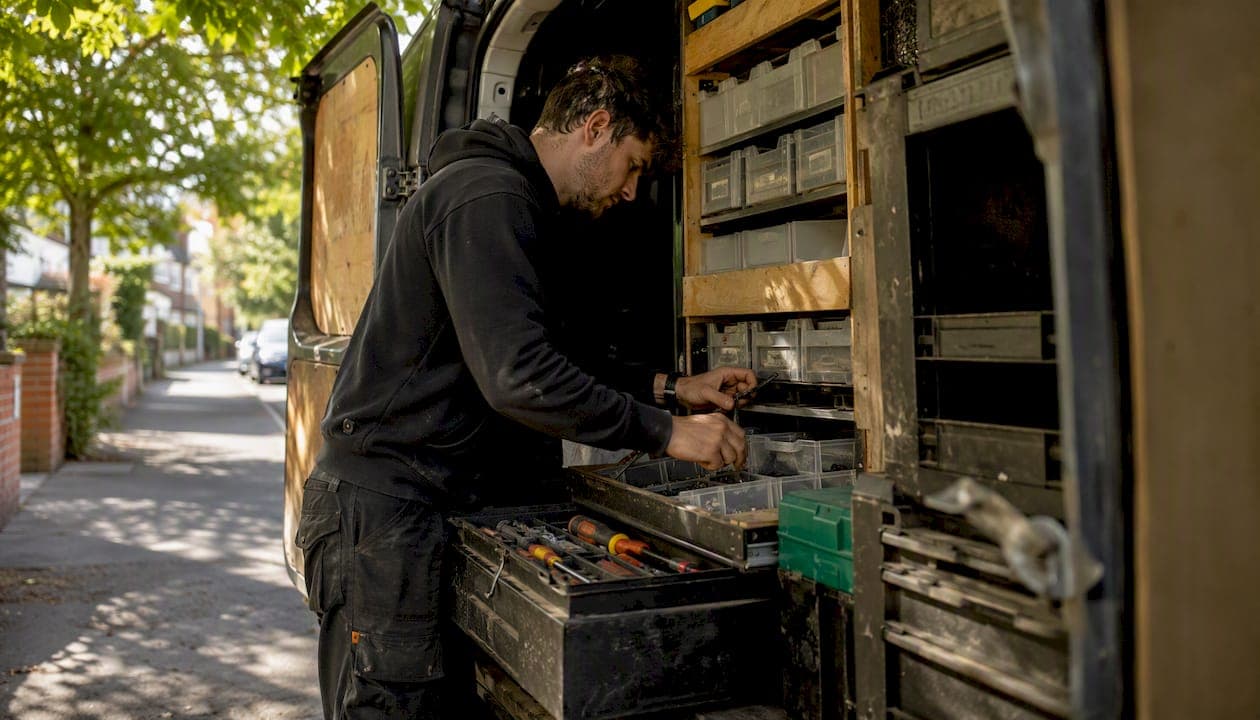
Your first time fix rate (FTFR) is the percentage of jobs your team resolves on the first onsite visit, with no return trips, no escalations, and no waiting on parts. The formula is straightforward:
(Jobs fixed on first visit ÷ Total jobs attended) × 100 = FTFR %
A quick example: if your team attends many jobs in a month and completes a high portion on the first visit, the FTFR is strong. According to IBM, the broader field service average sits around 80%, while best-in-class teams report figures between 89% and 98%. If performance is low, repeat visits are likely a major controllable cost.
Three things to do right now:
- Pull last month's job data and calculate your current FTFR by job type, not just overall.
- Identify the two or three job categories with the most repeat visits.
- Pick one root cause from those categories and fix it before the next reporting cycle.
Key takeaways
| Point | Details |
|---|---|
| Calculate FTFR by segment | Overall FTFR hides the job types causing most repeat visits; segment by job type, technician, and region. |
| Best-in-class benchmark | IBM data puts best-in-class FTFR between 89% and 98%; the broader average is around 80%. |
| Parts and intake drive most repeats | Missing parts and poor job intake account for the majority of repeat visits in UK trade businesses. |
| Validate with external surveys | Internal measurement overstates FTFR by 10–20% compared with customer survey methods; validate periodically. |
| Tradewisehq supports FTFR | Tradewisehq's scheduling, mobile parts ordering, and pre-visit communications directly reduce repeat visits. |
Table of Contents
- What actually counts as a first-time fix?
- FTFR versus first-contact resolution: which metric do you need?
- Why FTFR matters: cost, capacity, and customer satisfaction
- How to calculate your FTFR correctly
- Common causes of low FTFR: a diagnostic checklist
- Proven ways to raise your FTFR: an actionable checklist
- Measuring and reporting FTFR reliably
- Setting realistic FTFR targets and a 90-day improvement plan
- How Tradewisehq helps improve your FTFR
- The metric that reveals your whole operation
- Tradewisehq gives your team what they need before they arrive on site
- Sources
What actually counts as a first-time fix?
The definition sounds obvious until you hit the edge cases. A first-time fix means the job was fully resolved during the initial onsite visit, without a follow-up visit, without ordering parts that were not on the van, and without escalating to a specialist or manufacturer.
A first-time fix is not "we got it working for now." It means the fault is resolved, the asset is back to full function, and the customer has no reason to call back about the same issue.
Edge cases worth agreeing on before you start measuring:
- Warranty jobs — include them if your technician attended and resolved the fault. Exclude them only if the resolution required a manufacturer engineer to attend separately.
- Multi-part repairs where all parts were on the van — count as a first-time fix. The technician was prepared; that is the point.
- Temporary fixes — do not count. If the technician fitted a workaround and booked a return visit to complete the job properly, that is a repeat visit in waiting.
- Customer-initiated rebookings — if the customer cancelled or was not present and the fault was not attended at all, exclude the job from the denominator entirely. No visit means no data point.
- Same-day revisits — count as a repeat visit. Returning to the same property on the same day to collect a missed part is still a second truck roll.
- Remote-assisted fixes — if a technician resolved the fault onsite with remote technical support from a colleague, that still counts as a first-time fix. The customer received one visit.
Avoiding measurement inflation is where most teams go wrong. The two most common traps are closing work orders before the job is genuinely complete (to hit targets) and splitting a single job into two work orders so the second visit looks like a new job. Both distort your data and mask the real problem. Agree your counting rules in writing, share them with the team, and audit a sample of closed jobs each month.
FTFR versus first-contact resolution: which metric do you need?
They sound similar and are often confused, but they measure entirely different parts of the service chain.
First-contact resolution (FCR) measures whether a customer's issue was resolved during their first contact with your support team, typically a phone call, chat, or email. No field visit required. FCR is the right KPI for contact centres, remote support desks, and any team that resolves issues without sending a technician.
First time fix rate measures whether the issue was resolved during the first physical visit to site. It is the right KPI for field teams, truck rolls, and any service that requires a technician to attend in person.
The practical difference matters:
- A contact centre can improve its FCR by resolving more queries remotely, which may simultaneously reduce the number of truck rolls and improve FTFR by filtering out jobs that did not need a visit.
- A field team can have a poor FTFR even when FCR is excellent, if remote triage is good but van stocking or technician skills are weak.
Where the two metrics work together: remote pre-visit diagnosis is the clearest example. If your contact centre triages a fault properly before booking the job, the technician arrives knowing exactly what parts to bring. FCR does not improve (the customer still needed a visit), but FTFR rises because the technician is better prepared.
Both metrics matter; neither tells the full story alone.
Industry data on FCR puts the average external-survey FCR at around 70%, with "good" performance in the 70–79% range. FTFR averages run slightly higher, which reflects the fact that field teams have more preparation time before a visit than a contact agent has before a call.
Why FTFR matters: cost, capacity, and customer satisfaction
Every repeat visit has a direct cost and an opportunity cost. The direct cost includes a second set of travel time, labour hours, and fuel. The opportunity cost is the job that technician could have attended instead.
Improving FTFR by even a few percentage points can free up the equivalent of one additional technician's capacity per week on a team of ten, without hiring anyone.
Consider a team of ten technicians attending multiple jobs per day. Increasing FTFR can free up technician capacity and reduce repeat-visit costs substantially, recovering significant value over time.
Research from ServiceWorks Academy shows that a simple FTFR calculator using three inputs (total closed jobs, jobs fixed on first visit, and repeat-visit cost) is one of the fastest ways to quantify this for internal stakeholders. Run the numbers before you ask for budget for parts stock or scheduling software.
The customer satisfaction link is equally clear. Zendesk's research on first-contact resolution shows that each percentage-point improvement in resolution rate correlates with measurable gains in customer satisfaction scores. Field service leaders apply the same logic to FTFR: a customer who needed two visits to get their boiler fixed is a customer who is already considering switching supplier.
Pro Tip: Before your next team meeting, pull the repeat-visit data for the last 90 days and calculate the total cost using your actual average call-out rate. Present that single number. It tends to shift the conversation from "we're doing fine" to "what do we fix first" faster than any benchmark comparison.
A team with lower FTFR faces many more repeat visits, costing considerably more per month than a best-in-class team. Across a year, it funds a parts-stock overhaul, a scheduling tool, and technician training with money to spare.
How to calculate your FTFR correctly
The canonical formula is:
(Number of jobs resolved on first visit ÷ Total number of jobs attended) × 100
The scope decisions around that formula matter as much as the arithmetic.
Recommended time window for callbacks: count a job as a repeat visit if the same fault at the same address is attended again within 30 days. Some teams use 14 days; some use 60. Thirty days is the most common UK field service standard and captures the majority of genuine repeat visits without penalising technicians for unrelated faults at the same property.
The same data broken down by job type, technician, region, and asset class tells you exactly where to intervene.
The table above shows why overall FTFR is a starting point, not a destination. Boiler fault jobs are dragging the number down. That is where the investigation starts.
Common data errors to avoid:
- Double-counting closed jobs — if your system auto-closes jobs after a set period, verify that closure reflects genuine completion, not a timeout.
- Incomplete work order closes — technicians who close jobs on paper but not in the system create phantom completions. Mobile job management closes the gap.
- Warranty exclusions applied inconsistently — agree the rule once and apply it to every job, not just the ones that suit the target.
PTC's analysis of FTFR confirms that missing parts, skill gaps, and poor communication are the dominant causes of low FTFR, which means the calculation is only useful if the segmentation points you toward one of those three root causes.
Common causes of low FTFR: a diagnostic checklist
Low FTFR is almost always a systems failure, not a technician failure. The fault usually sits upstream of the visit itself.
Parts and inventory:
- Wrong parts ordered at booking because the fault description was vague
- Van stock not replenished after the previous job used the last of a common component
- Supplier lead times mean the part cannot be sourced same-day
- No mobile ordering capability, so the technician cannot order on site and must rebook
Skills and training:
- Technician assigned to a job type outside their core competency
- No access to job-specific troubleshooting guides on site
- New starters paired with complex fault types before they are ready
- Certification gaps on specialist equipment (heat pumps, smart meters, commercial HVAC)
Job intake and documentation:
- Customer describes the symptom rather than the fault, and no one probes further
- Asset details (make, model, age, previous faults) not captured at booking
- Access requirements not confirmed in advance (key safe codes, restricted hours, third-party permission needed)
- Photos or video of the fault not requested before dispatch
Scheduling and access:
- Customer not present when the technician arrives
- Access window too short for a complex job
- Job slotted to the nearest available technician rather than the most appropriate one
Process and incentives:
- Work orders split to meet daily job-count targets, making a two-visit job look like two first-time fixes
- Technicians penalised for time on site rather than rewarded for resolution quality
- No feedback loop between repeat-visit data and the booking team
Pro Tip: Map your last 20 repeat visits to one of these five categories. In most UK trade businesses, parts and job intake account for over half of all repeat visits. Fix those two areas first before touching anything else.
Proven ways to raise your FTFR: an actionable checklist
Start with the job types causing the most repeat visits, not the easiest wins.
1. Prioritise by impact
Pull your repeat-visit data by job type and sort by volume of repeats, not by FTFR percentage. Fix the high-volume problem first.
2. Improve van stocking and parts readiness
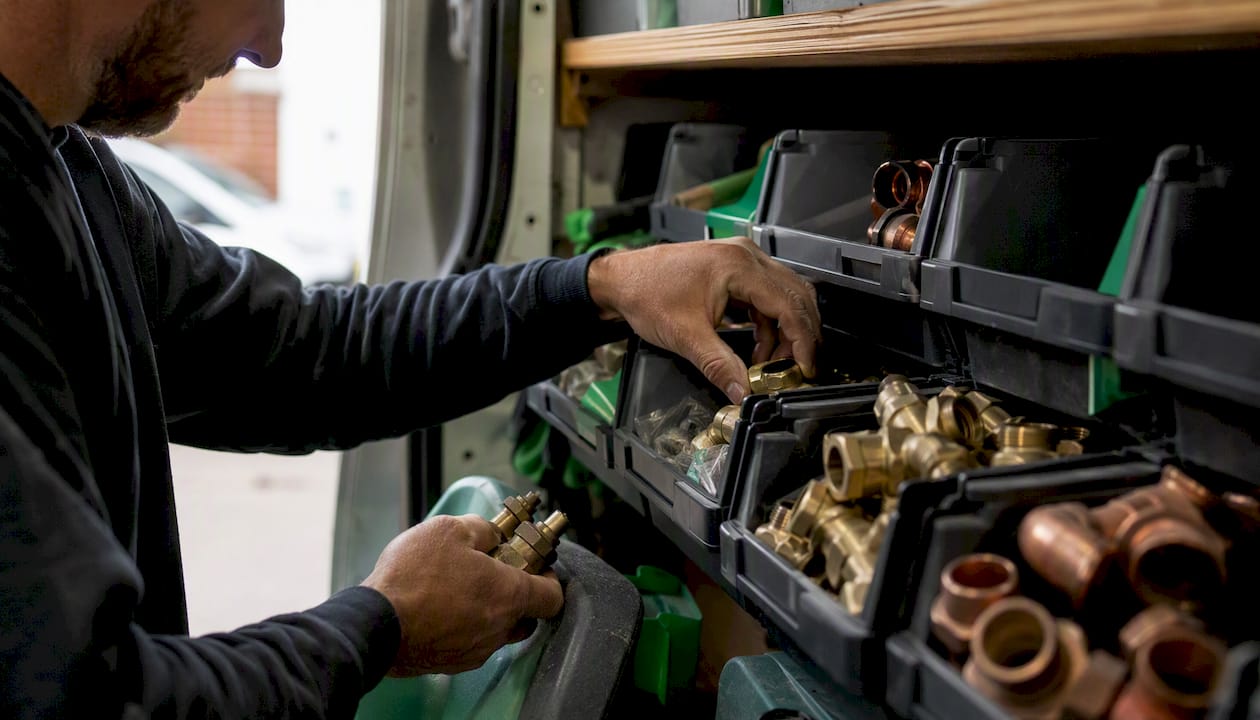
Review the parts used in your top five repeat-visit job types and ensure every van carries them as standard. Mobile ordering through a platform like Tradewisehq means a technician who discovers a missing part on site can order it immediately rather than rebooking. Local parts pooling between nearby technicians reduces wait times further.
3. Assign the right technician to the right job
Scheduling by availability rather than skill is one of the fastest routes to a repeat visit. Build a skills matrix, tag job types to required competencies, and let your dispatch logic reflect that. Mobile software built for construction and trades makes this kind of live skills-based dispatch practical even for small teams.
4. Improve job intake quality
The fault description the customer gives at booking is the foundation of the entire visit. Train booking staff to ask for asset make, model, age, and a description of what the asset is doing rather than what the customer thinks is wrong. Request photos where possible. Accurate job intake through digital quoting reduces parts errors significantly.
5. Use remote diagnostics before dispatch
A short pre-visit video call with the customer can confirm the fault, validate the parts list, and occasionally resolve the issue without a visit at all. Microsoft's field service research found that pre-visit remote diagnostics and parts readiness improvements are among the most consistently effective levers for raising FTFR.
6. Build mobile knowledge bases for technicians
A technician who can pull up a fault-specific troubleshooting guide on their phone while standing in front of the asset is more likely to resolve the fault on the first visit. Job-specific playbooks, wiring diagrams, and manufacturer service notes should be accessible in the field, not filed in the office.
7. Fix the incentive structure
If your technicians are measured on jobs completed per day, splitting a complex job into two work orders looks rational from their perspective. Align incentives with resolution quality: track FTFR at technician level, share it transparently, and reward improvement rather than volume.
8. Confirm access before every visit
Customer not present is a simple, preventable cause of a failed visit. A pre-visit SMS or call the day before, confirming the appointment and any access requirements, costs almost nothing. Client communication best practices for trades businesses show that confirmation messages reduce access failures by a meaningful margin.
Quick wins by timeframe:
- Under 30 days: calculate FTFR by job type, identify the top three repeat-visit categories, and confirm access for every job the day before.
- 30–60 days: review van stock for the top repeat-visit job types, introduce pre-visit video triage for complex faults, and fix the work order splitting problem.
- 60–90 days: build a skills matrix, update dispatch logic to match skills to job types, and introduce mobile knowledge bases for the highest-volume fault types.
Pro Tip: The 30-day quick wins cost almost nothing. Run them in parallel with the longer-term changes rather than waiting until the system is perfect.
Measuring and reporting FTFR reliably
A number you cannot trust is worse than no number. These are the measurement pitfalls that distort FTFR data most often in UK trade businesses.
Common pitfalls:
- Internal measurement overstates performance. Relying on no-repeat-visits within a time window using your own job management data typically overstates FTFR by 10–20% compared with external customer survey methods, according to first-call resolution research. Validate your internal figure with periodic customer surveys.
- Callback window too short. A 7-day window misses faults that recur after the initial fix holds for a week. Thirty days is the standard.
- Closing behaviour distorts the data. If technicians or admin staff close jobs before they are genuinely complete, your FTFR looks better than it is. Audit a sample of closed jobs monthly.
- Warranty and ad-hoc jobs mixed with contract jobs. These have different complexity profiles. Mixing them produces an average that is useful to no one.
Recommended reporting cadence:
- Daily: a simple health-check dashboard showing jobs attended, first-time fixes, and open repeat visits. Flags problems before they compound.
- Weekly: trend line by job type and technician. Enough data to spot a pattern; early enough to intervene.
- Monthly: root-cause drilldown. Which job types, which technicians, which fault categories are driving repeat visits? This is where the improvement plan gets updated.
Metrics to pair with FTFR:
| Metric | What it adds | Why it matters alongside FTFR |
|---|---|---|
| Repeat-visit cost | Financial impact of low FTFR | Converts the percentage into a number the business cares about |
| Mean time to repair (MTTR) | How long resolution takes | High FTFR with high MTTR may indicate over-complex jobs need splitting |
| Technician utilisation | Capacity picture | Freed capacity from FTFR gains shows up here |
| Customer satisfaction score | Customer experience | Validates that FTFR improvements are felt by the customer |
Segmenting FTFR by job complexity and contract type is particularly useful. Treating them as one number obscures both.
Setting realistic FTFR targets and a 90-day improvement plan
Start with your baseline, not with the benchmark.
How to set tiered targets:
- Calculate your current FTFR overall, then by job type, technician, and region.
- Identify the two or three segments furthest below your overall average.
- Set a 90-day target for each segment that is achievable given the root cause (parts issue = faster fix; skills gap = slower fix).
- Set an overall target that reflects the weighted improvement across segments.
Suggested OKRs for a 90-day sprint:
- Objective: Reduce repeat visits by improving first-time fix rate across the top three repeat-visit job categories.
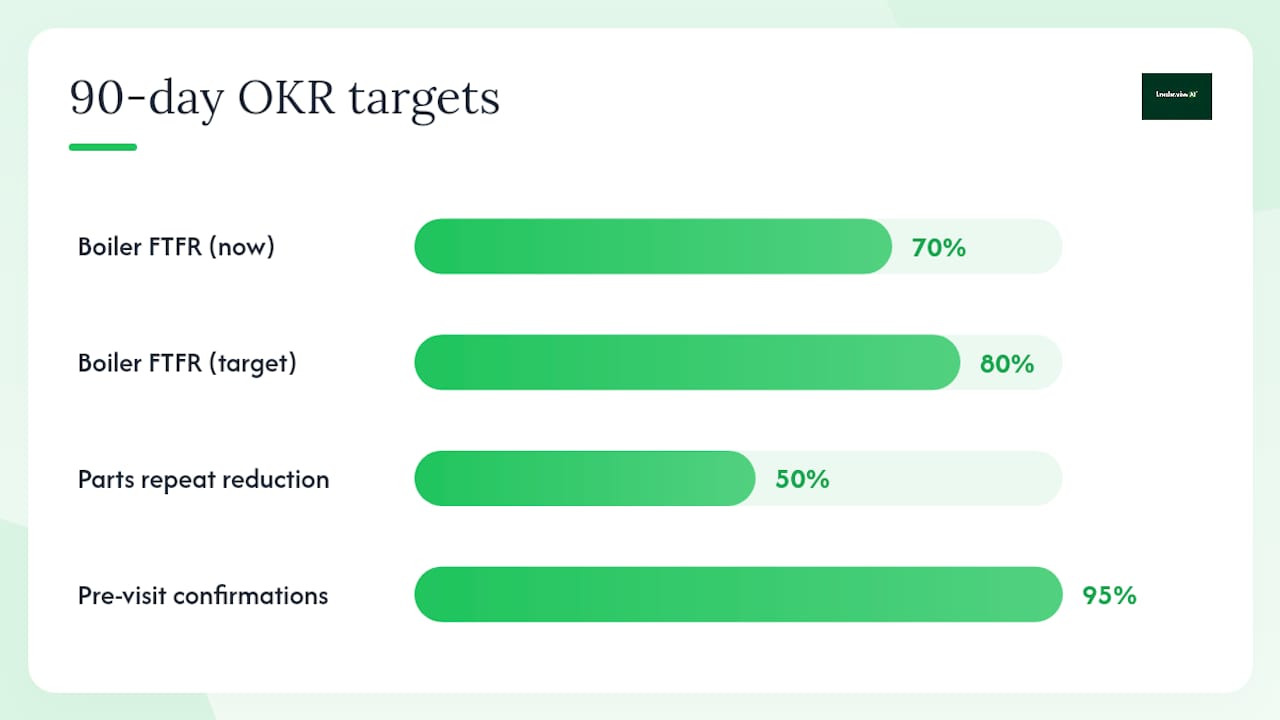
- Key Result 1: Raise FTFR on boiler fault jobs from 70% to 80% within 90 days.
- Key Result 2: Reduce parts-related repeat visits by 50% through improved van stocking and mobile ordering.
- Key Result 3: Achieve pre-visit confirmation for 95% of all booked jobs by day 30.
A sample 90-day timeline:
- Days 1–14: baseline measurement, root-cause analysis, team briefing. Agree counting rules and reporting format.
- Days 15–30: implement quick wins (access confirmation, van stock review, work order splitting policy).
- Days 31–60: introduce pre-visit triage, update dispatch logic for skills matching, begin mobile knowledge base build.
- Days 61–90: review FTFR data against targets, identify what worked, document the process, and roll successful changes into standard operating procedure.
Pro Tip: At the 30-day checkpoint, share the FTFR data with the whole team, not just managers. Technicians who can see their own first-time fix rate alongside their peers tend to self-correct faster than any top-down intervention.
Rolling a successful experiment into business-as-usual means updating your onboarding process, your van stock list, and your dispatch rules so the improvement does not depend on anyone remembering to do it differently. Embed it in the system.
How Tradewisehq helps improve your FTFR
Tradewisehq is built around the workflows that directly affect first-time fix rate: scheduling, parts, job documentation, and customer communication. Here is how specific features translate into FTFR outcomes.
Feature to outcome mapping:
- Skills-based scheduling: assigns the right technician to the right job type, reducing skill-mismatch repeat visits.
- Mobile job notes: technicians capture fault details, photos, and asset data on site, creating an accurate record that supports future visits and reduces intake errors.
- Live parts status and mobile ordering: technicians check stock and order parts from the van, cutting the "wrong part" repeat visit.
- AI-driven admin automation: reduces the time technicians spend on paperwork, freeing attention for thorough fault diagnosis. Details on Tradewisehq's AI features are covered in the AI disclaimer.
- Customer pre-visit communications: automated confirmations reduce access failures and ensure the customer is present and prepared.
Tradewisehq's mobile-first design means technicians access job notes, parts lists, and troubleshooting resources from their phone on site, without needing to call the office. That single change reduces the "I didn't have the information I needed" repeat visit category significantly. Job management software for UK builders explains the broader operational gains from this kind of platform.
Implementation checklist for the first 90 days:
- Days 1–30: set up job types and skills tags, configure van stock lists, activate pre-visit confirmation messages. Measure baseline FTFR by job type.
- Days 31–60: review first month's FTFR data, identify top repeat-visit categories, adjust van stock and dispatch rules. Enable mobile parts ordering for field technicians.
- Days 61–90: build job-specific mobile notes templates for the highest-volume fault types. Run a root-cause review using Tradewisehq's job history data and present findings to stakeholders.
Metrics to track for internal stakeholder buy-in:
- FTFR before and after implementation, segmented by job type
- Repeat-visit cost per month (total repeat visits × average call-out cost)
- Technician utilisation rate (freed capacity from fewer repeat visits)
- Customer satisfaction scores on completed jobs
The metric that reveals your whole operation
Most FTFR improvement programmes start in the wrong place. They focus on the technician: more training, better tools, sharper skills. Those things matter, but they are the last mile of a much longer chain.
They are the ones who fixed the booking process, updated the van stock list, and stopped splitting work orders to hit daily job counts. The technician's job became easier because the system around them got better.
There is also a cultural trap worth naming. In many UK trade businesses, FTFR data gets used as a blame metric: "Why did you go back to that job?" That framing guarantees two things: technicians start gaming the data, and the real root causes stay hidden. Use FTFR as a systems diagnostic. When a repeat visit happens, the question is not "who failed?" but "where did the system fail this technician?"
The other thing I see consistently underestimated is the access problem. Van stocking and skills matching get all the attention, but in dense urban areas and multi-occupancy buildings, customer not present and restricted access windows are responsible for a surprisingly large share of repeat visits. Pre-visit confirmation is the cheapest FTFR intervention available and the one most teams skip.
Tradewisehq gives your team what they need before they arrive on site
Repeat visits are expensive, and most of them are preventable. Tradewisehq gives field service managers the tools to fix the three biggest drivers of low FTFR: poor job intake, parts gaps, and access failures.
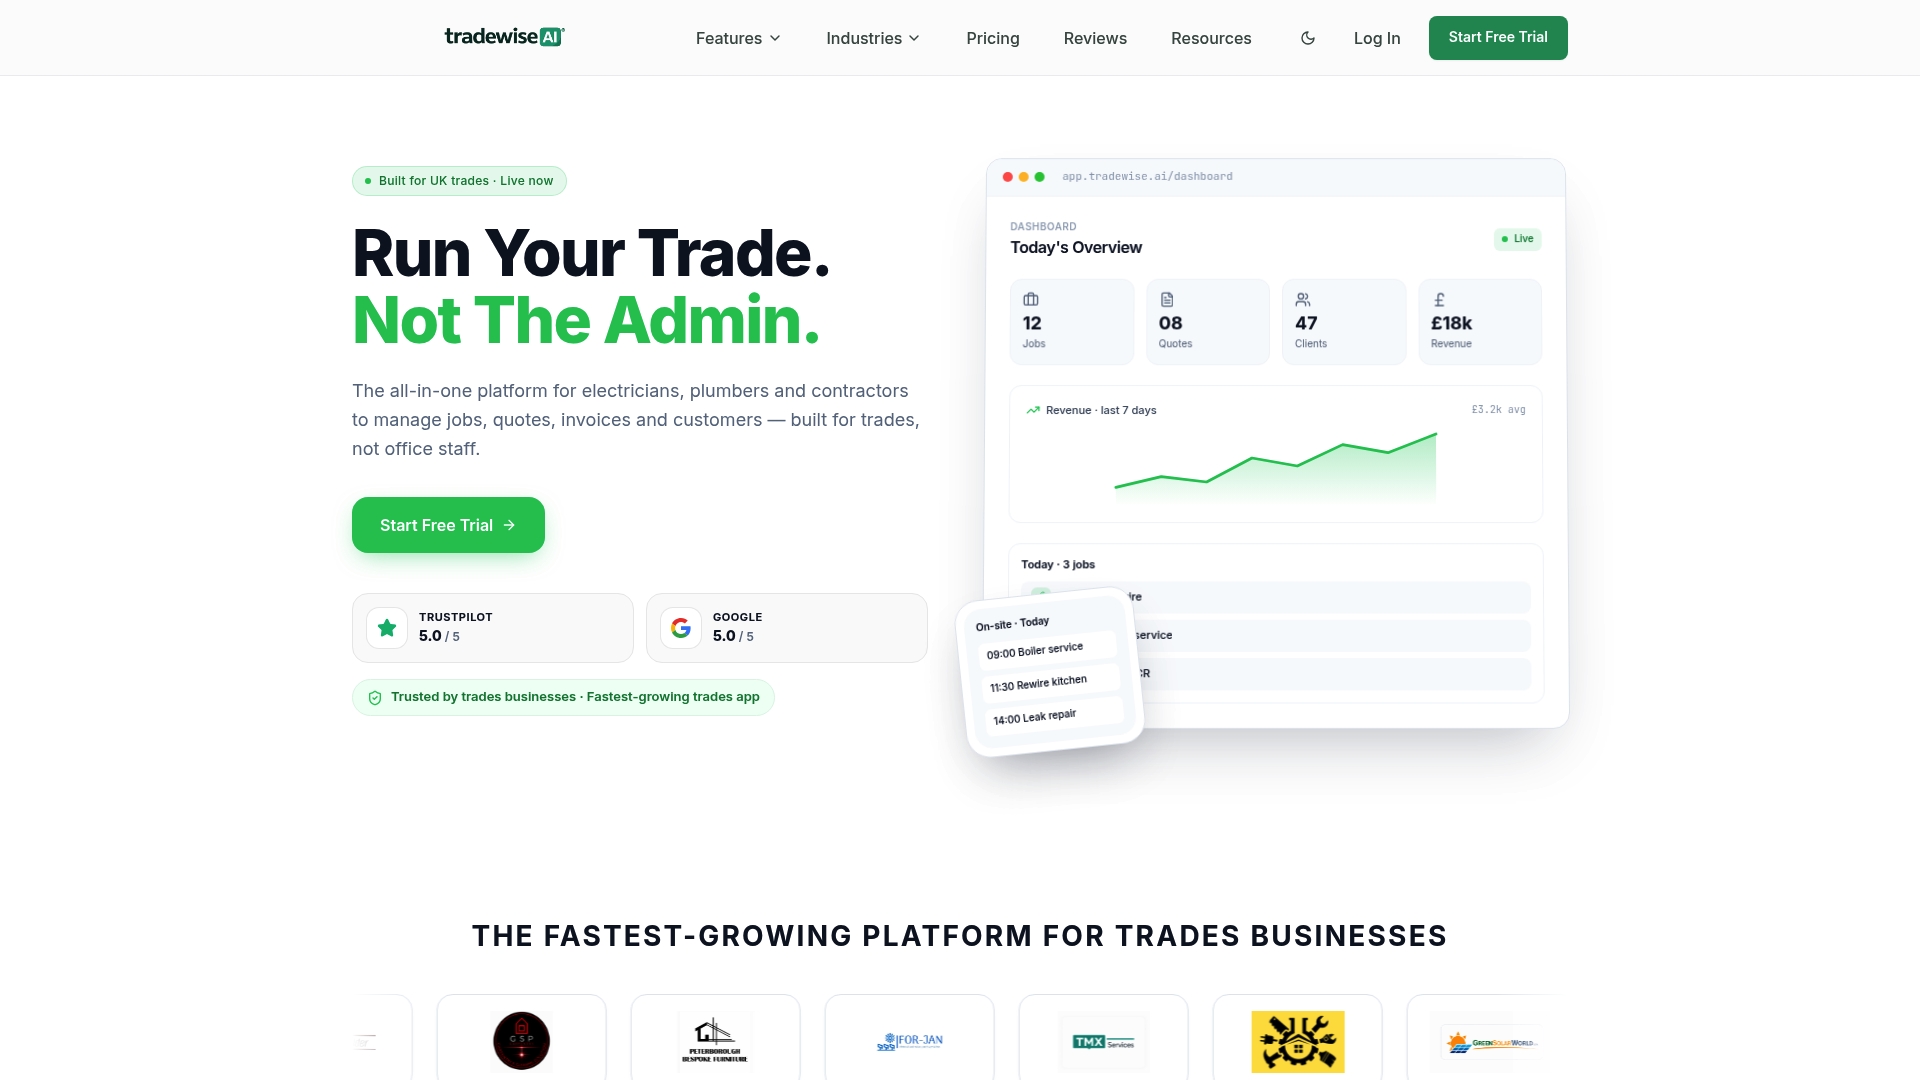
With Tradewisehq, your team gets skills-based scheduling, live parts ordering from the van, automated pre-visit customer confirmations, and mobile job notes that capture everything the next technician needs. The AI-powered admin layer means less time on paperwork and more attention on the fault in front of them.
Start a 14-day free trial at Tradewisehq and see how much of your repeat-visit cost disappears when your team arrives prepared.
Sources
- What is First-Time Fix Rate (FTFR)? | IBM
- What is First-Time Fix Rate (FTFR)? | PTC
- What is first contact resolution (FCR)? Benefits + best practices | Zendesk
- First call resolution